With a design reminiscent of a NORAD nuclear weapons map from the film War Games, online security firm Norse has released a map showing the scale of hacking across the world at this very moment.
In an attempt to get an idea of what the current level of activity with regard to hacking looks like, Norse set up a ‘honeypot’ server to judge where and when attacks are coming from.
While not a counter for every single hack attempt worldwide, you’d be mistaken for thinking it is, given the rate at which the mesmerising colours flash across the screen every second.
Highlighted by the Smithsonian, the map breaks down each attack into categories: who the attack targets are, where the attacks are coming from, and what type of attacks are occurring.
The United States dominates the list of most attacked nations with, at the time of writing, 1,407 attacks counted, compared with the second-highest country being attacked, Hong Kong, at 90.
However, the US can hardly lay claim to being merely a target for attacks, as it is also the biggest instigator at 440 attacks in the space of 10 minutes, while China comes second at 330, and Russia with 237.
Check out the map here and prepare to be hypnotised and frightened at the same time.
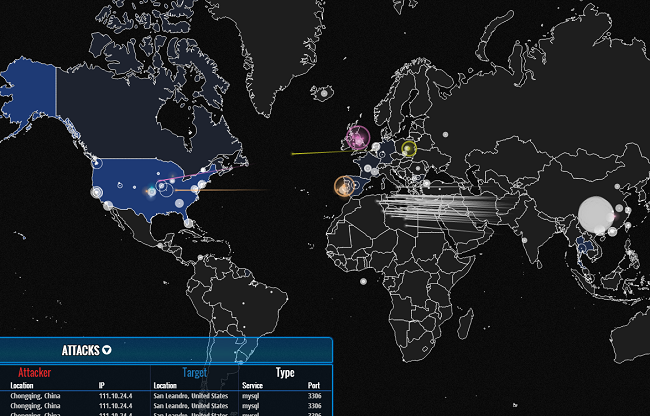
A still from the Norse live hacking map.
Global watch image via Shutterstock