Oliver Mooney, founder of GetBulb, and Jane Ruffino, chief marketing officer at the start-up
Our tech start-up of the week is GetBulb, a new Dublin-based venture that has come up with a data visualisation tool to allow people to create infographics to communicate their data more meaningfully.
With the growing popularity of infographics, GetBulb is on a mission to make data visualisation more compelling via its tool – a HTML5 app that can be downloaded for any modern desktop web browser.
Oliver Mooney founded GetBulb in 2011 and has since taken part in the Startupbootcamp start-up accelerator in Dublin, as well as winning The Irish Times Digital Challenge last year.
So how did the idea for GetBulb come about? Having worked as a data scientist for a number of years, Mooney says he had always struggled to communicate his data findings in a meaningful way.
“Anybody who’s ever made a bar chart in Excel has been disappointed with the results,” he says. “Excel has a small set of good visualisations, but it’s not great at combining them or exporting them.”
Visual stories
He set out to develop a tool targeted at helping analysts express data insights visually.
“GetBulb helps people with interesting sets of data tell visual stories about that data. These range from simple visualisations to full-blown infographics.”
The charts that GetBulb creates will work across web and print.
Mooney is eager to get across that anyone who can copy and paste can use GetBulb. Indeed, the start-up brought out a fun video earlier this year to pitch how easy the tool will be for users.
“Select your data in any popular spreadsheet, hit copy, switch to our app and paste in your data. You get a great visualisation immediately,” he says.
GetBulb has a gallery of templates that people can choose from. Users can also add additional data sets using the app’s visual elements and layout tools to tell a larger story or to compare and contrast different sets of data. There is also the scope to add in corporate logos and images.
“When you’re done, you can export it for any destination, from high-resolution print graphics to shared interactive widgets for blogs or company web pages,” says Mooney.
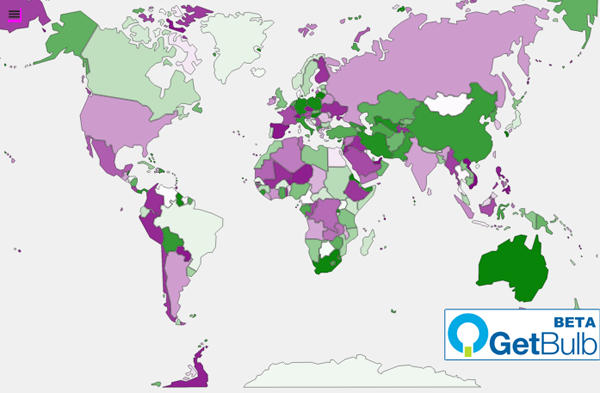
World map data visualisation tool created by GetBulb
Beta mode
In July, GetBulb is going into beta mode and has already signed up about 500 users to take part in the programme. A few select users will get a peek of the app this month.
“We’ve already done some initial visualisations for customers using the app.”
This year, Mooney ramped up the team at GetBulb and there are now six people working at the start-up, including developers and marketers.
Jane Ruffino is chief marketing officer at GetBulb and she says people can still sign up for the beta programme.
“We want to see who is using the product the most. You will be able to play with it to see how your data looks online,” she explains. “It’s really to figure out what features to add and what people want.”
That done, Mooney says that the team will work to polish the app and get it into the hands of as many people as possible.
As well as this, the plan is for GetBulb to eventually add a system whereby designers can upload and sell their template designs.
“We will have a marketplace because we want to have a really wide range of templates that people will use,” explains Ruffino.
Trial customers of Stripe
GetBulb has also been approved as one of the trial customers of Stripe, the online payments engine co-founded by brothers Patrick and John Collison from Limerick.
“We heard through the grapevine that Stripe were looking for beta customers and we jumped at the chance,” explains Mooney. “Their product lets us experiment with different payment models cleanly while handling the vast majority of security and privacy concerns for us.”
And, in terms of connecting with potential investors, Ruffino says GetBulb has had a lot of interest.
“We’re always meeting with investors and talking to people about it and we’re also talking to investors about what we should be doing.”
At the moment, Ruffino says it’s about getting the product out and getting some traction and then going back and doing more focused pitching to investors.
“Everybody wants data but it’s actually meaningless on its own. We’re making it easier for people to tell stories,” she says. “That’s why people like infographics. What makes a good infographic is your brain engages in a way that it doesn’t with a linear narrative.”