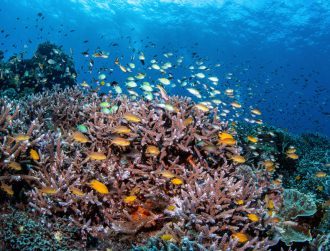
‘Nightlights’ data over San Francisco bay. Image: NASA
A collaboration between three of the largest space agencies in the world will let researchers use satellite data to track the impact of Covid-19 on the environment.
NASA, ESA and the Japanese Aerospace Exploration Agency (JAXA) have unveiled a new tool designed to give researchers and policymakers access to planet-wide changes in the environment and human society following the coronavirus pandemic.
The Covid-19 Earth Observation Dashboard integrates multiple satellite data records with analytical tools to allow user-friendly tracking of changes in air and water quality, climate, economic activity, and agriculture.
Established following a meeting in April between the three space agencies, the map and dashboard will be updated with new satellite observations over the coming months as economies around the world gradually reopen.
‘A powerful new analytical tool’
“Together NASA, ESA, and JAXA represent a great human asset: advanced Earth-observing instruments in space that are used every day to benefit society and advance knowledge about our home planet,” said Thomas Zurbuchen, NASA associate administrator for science.
“When we began to see from space how changing patterns of human activity caused by the pandemic were having a visible impact on the planet, we knew that if we combined resources, we could bring a powerful new analytical tool to bear on this fast-moving crisis.”
Air pollution and carbon emissions were some of the first noticeable changes to our planet as international travel was reduced substantially and almost half the world was told to stay at home. In Ireland last month, there was a decrease of up to 50pc recorded in concentrations of the greenhouse gas nitrogen oxide (NO2), while back in March a similar drop was recorded in levels of carbon monoxide in New York.
‘Helping humanity navigate through this crisis’
The new dashboard brings together current NO2 data from two NASA and ESA satellites, along with historical data for comparison. In additional to the global view of NO2, targeted regional areas include Los Angeles, Tokyo, Beijing, Paris, and Madrid.
In testing, analysis from NASA and JAXA datasets on CO2 levels in some of the world’s biggest cities was found to be in line with a recent study published to Nature. This study estimated that a three-month economic slowdown, such as the one caused by Covid-19, would reduce the expected increase in CO2 concentrations from emissions into the atmosphere by a fraction of a percent.
Water quality changes have also been reported in areas typically associated with intense human activities, such as industry and tourism. The dashboard presents targeted satellite observations from all three agencies of total suspended matter and chlorophyll concentrations in these regions to assess what has produced these changes in water quality, how widespread they may be, and how long they last.
ESA’s director for Earth Observation, Josef Aschbacher, said: “Through this, we are making sure that our Earth observation programmes deliver their full potential to society, and in doing so, are helping humanity navigate through this crisis with more accurate information at its disposal.”