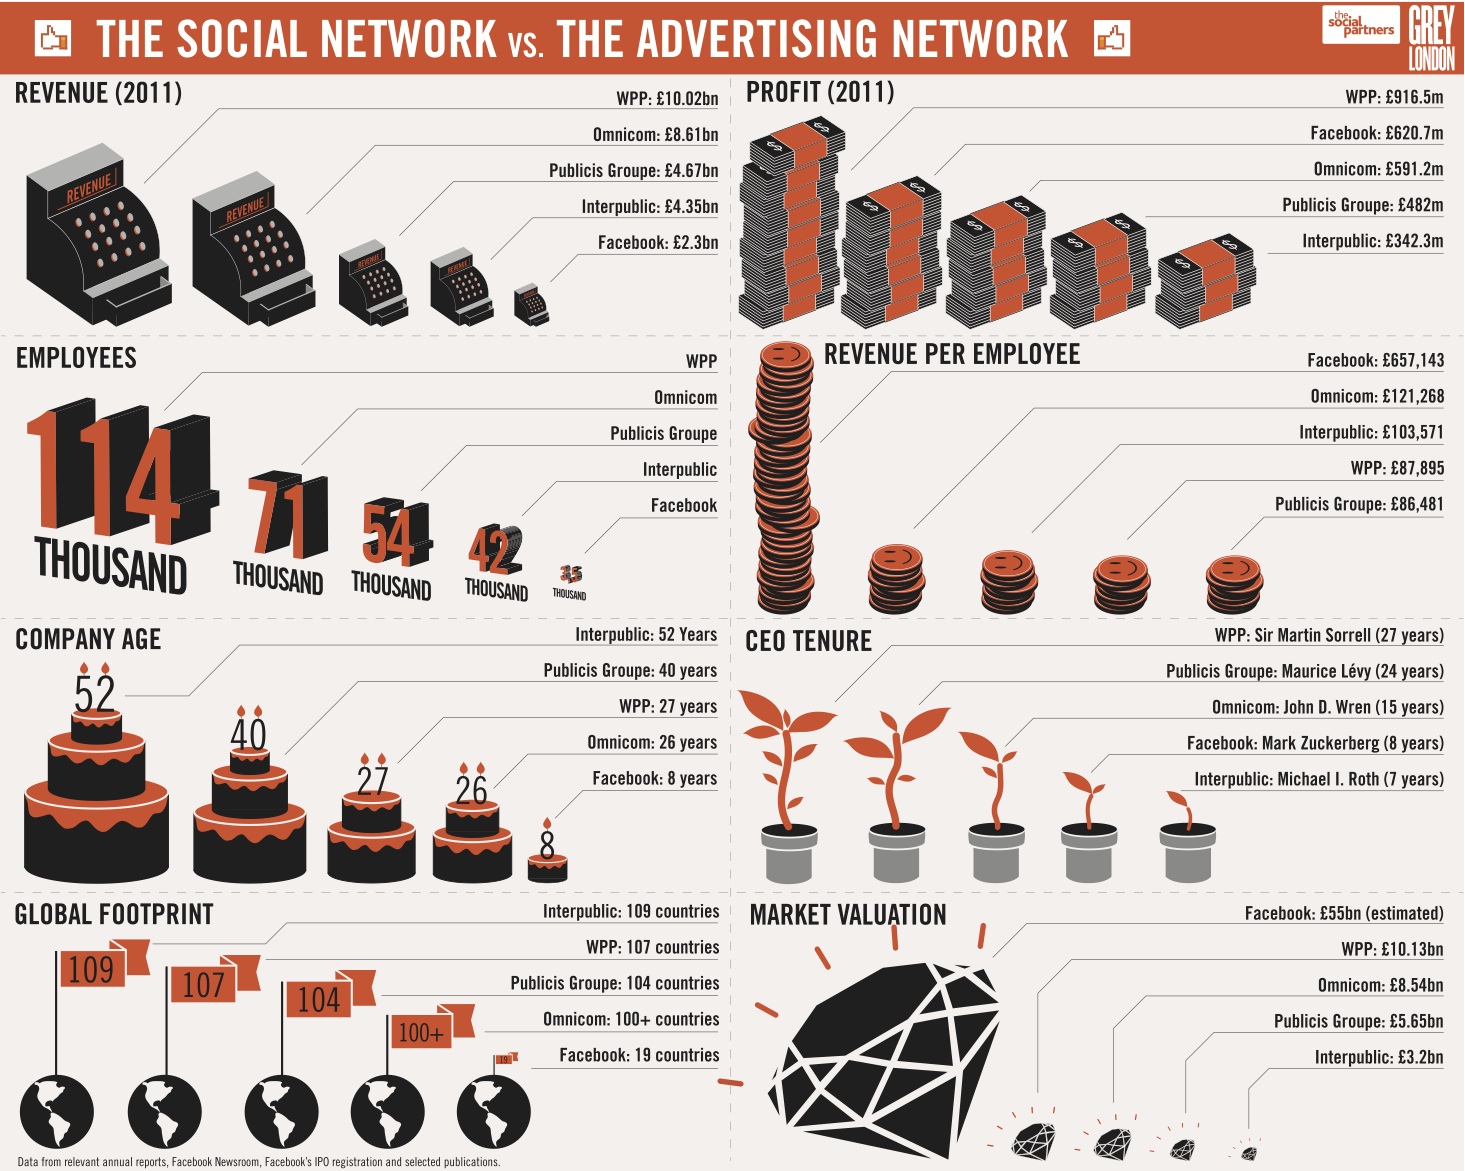
Just in time for Facebook’s IPO today, a new infographic compares global ad networks such as WPP and Publicis Groupe with the social network across a few different metrics.
The infographic by Grey London charts categories such as 2011 profit, 2011 revenue, revenue per employee, number of employees, company age, global footprint, CEO tenure, and market valuation.
Facebook falls into last place when it comes to 2011 revenue (stg£2.3bn versus stg£10.02bn from WWP); number of employees (15,000 versus 114,000 at WWP); company age (Facebook is eight years old, Interpublic is 52); and global footprint (19 countries for Facebook, whereas Interpublic hits 109 countries).
Facebook does rank first in a couple of categories, however: revenue per employee (stg£657,143) and market valuation (an estimated £55bn).
The social network is in second place when it comes to 2011 profit (stg£620.7m) and in fourth place for CEO tenure (eight years for Mark Zuckerberg).
Facebook has set the final price for its IPO at US$38 a share in a flotation that will reap the company US$16bn-US$18bn. This is likely to value the social network at US$104bn – the biggest valuation of a US company at IPO.