
Image: Katiekk/Shutterstock
The first complete map of Antarctica’s retreating submarine edge has thrown up some surprising discoveries for polar scientists.
Antarctica has lost an area of underwater ice about as large as the entire county of Leitrim over a period of seven years.
Using satellite data, a team led by Dr Hannes Konrad from the Centre for Polar Observation and Modelling (CPOM) has determined a loss of about 1,463 sq km of ice beneath Antarctica. The loss is driven by rising ocean temperatures and has largely impacted the Amundsen Sea area in western Antarctica.
However, the team also noted that ocean melting at the base of the Pine Island Glacier – until now known as the fastest-melting glacier on the icy continent – has apparently abated.

Deep-sea visuals from CryoSat
The CPOM team at University of Leeds used the European Space Agency’s CryoSat-2 satellite for this research, which was published in Nature Geoscience.
CryoSat-2 was originally designed to measure changes in the ice-sheet elevation but, using the Archimedes principle and known details of the glacier and seafloor geometry, it was possible to interpret the horizontal motion of the ice sheet’s grounding line. That is, the point at the base of the glacier where it leaves the seabed and begins to float.
Grounding lines can edge deep beneath the ice shelf, often a kilometre or more below sea level, making them practically impossible to access from below and typically invisible on the ground. CryoSat’s remote monitoring, however, allowed researchers to take in observations of the whole continent and helped produce the first complete map of Antarctica’s shifting grounding lines.
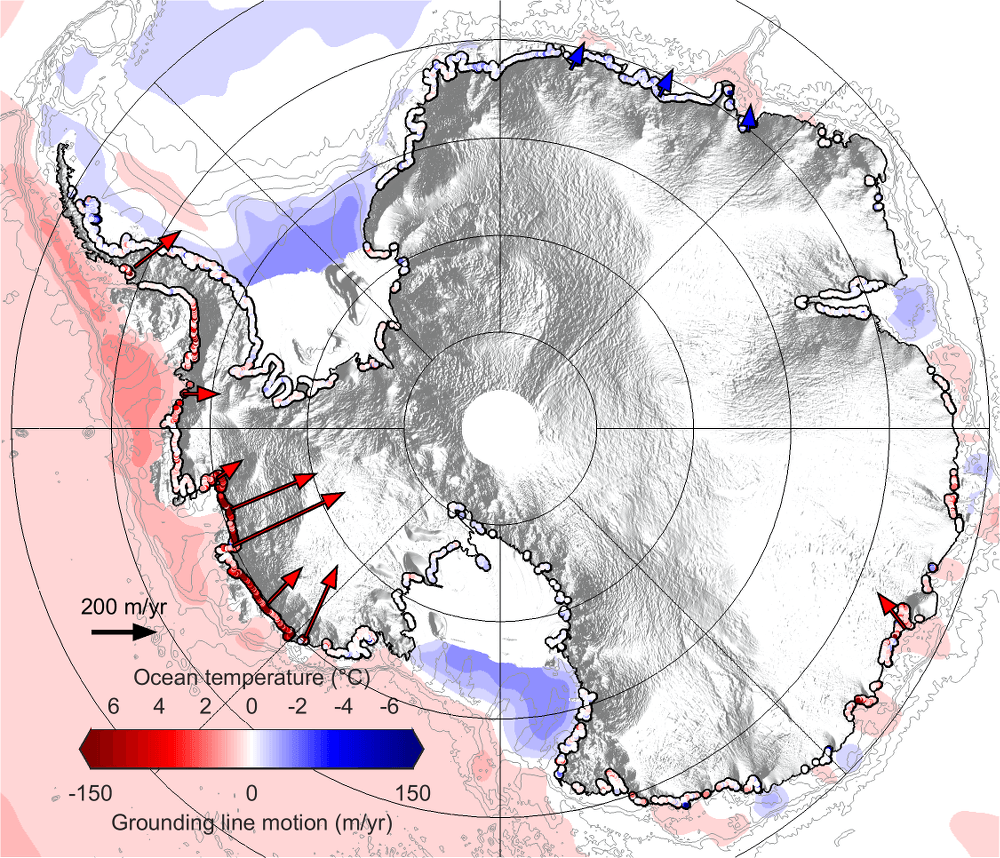
Map showing rates of grounding-line migration and their coincidence with ocean conditions around Antarctica between 2010 and 2016 (seabed temperatures: Locarnini et al, 2013. World Ocean Atlas 2013, Volume 1: Temperature. S Levitus, Ed, A Mishonov Technical Ed. NOAA Atlas NESDIS 73, 40 pp). Grounding line locations are from Rignot et al, 2013, Science 341 (6143), pp 266-270. Image: Hannes Konrad et al, University of Leeds
What lies beneath
Mapping grounding-line motion along 16,000km of Antarctic coastline between 2010 and 2016, the researchers have uncovered the drastic melt caused by the Southern Ocean.
The pace of deglaciation since the last ice age is about 25m per year. Grounding-line retreat at eight of the continent’s 65 biggest glaciers is considered extreme in that it measures more than five times that.
“Our study provides clear evidence that retreat is happening across the ice sheet due to ocean melting at its base, and not just at the few spots that have been mapped before now,” said Konrad.
“This retreat has had a huge impact on inland glaciers, because releasing them from the seabed removes friction, causing them to speed up and contribute to global sea-level rise.”

Illustration showing how horizontal motion of glacier grounding lines is detected using satellite measurements of their elevation change. Image: Hannes Konrad et al, University of Leeds
More than one-fifth of the West Antarctica ice sheet has retreated faster than the pace of deglaciation, but, surprisingly, CryoSat data from the Pine Island Glacier – which is the source of about a quarter of Antarctica’s ice loss – indicates that the submarine melt here has stopped.
“These differences emphasise the complex nature of ice-sheet instability across the continent, and being able to detect them helps us to pinpoint areas that deserve further investigation,” Konrad explained.


