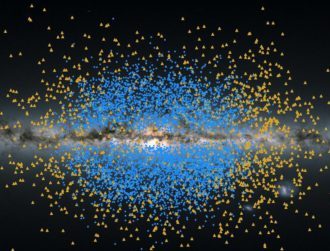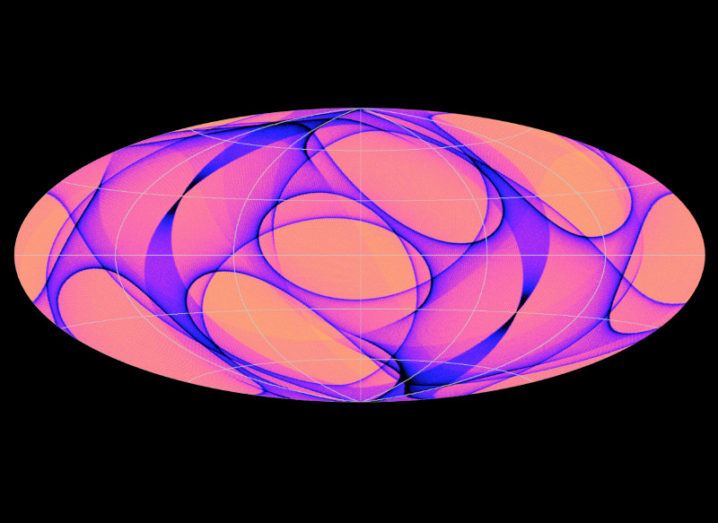
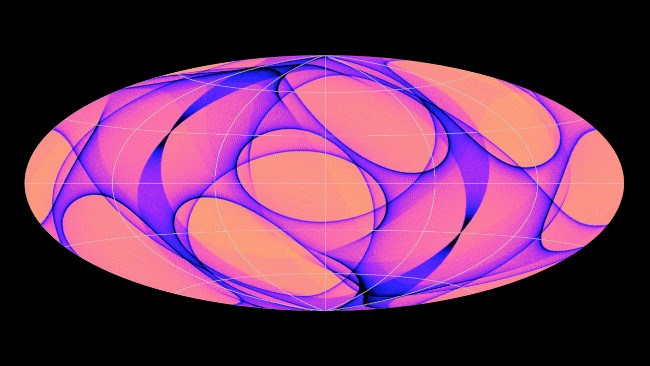
Gaia scan of the entire sky. Image: ESA/Gaia/DPAC; acknowledgement: B Holl (University of Geneva, Switzerland)/DPAC
The ESA has revealed how scans of the sky are actually achieved, with a colourful, oval masterpiece as an example.
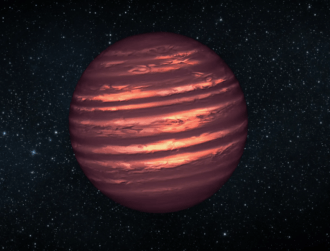
The European Space Agency’s (ESA) Gaia satellite began operations in July 2014, producing detailed catalogues of more than 1bn stars in its first 14 months.
It remains the largest all-sky survey of celestial objects to date – but how was it done?
Colourfully, of course.
Gaia scan of the entire sky. Image: ESA/Gaia/DPAC; acknowledgement: B Holl (University of Geneva, Switzerland)/DPAC
Resembling a brightly decorated Easter egg, the image actually shows how Gaia got the job done.
The main oval represents the entire celestial sphere, with the colours indicating how frequently the different portions of the sky were scanned.
In this instance, blue represents the regions scanned most often in that time period, with the lighter colours denoting the less frequent ones.
The satellite spends around six hours scanning the sky in great big circles, with the opening month seeing the ecliptic poles constantly included.
Gaia is the largest camera ever launched into space. With a resolution of 1bn pixels, it is considered so powerful that it is capable of gauging the diameter of a human hair from a distance of 1,000km.
Last September, at the half-way point in Gaia’s five-year mission, the ESA released a 3D map of the Milky Way, about 1,000 times more accurate than any that have preceded it.

Gaia’s first sky map. Image: ESA/Gaia/DPAC
Showing the incomprehensible scale of the universe, this superior 3D map covers an area 100,000 light years in diameter – still only 1pc of the Milky Way’s stellar population.
One of the Gaia team members, François Mignard, described the map as a “new chapter in astronomy” at the time.
“Over the centuries, we have sought to catalogue the content of the skies,” Mignard said. “But never have we achieved anything so complete or precise – it is a massive undertaking.”
The map will be completed this year.